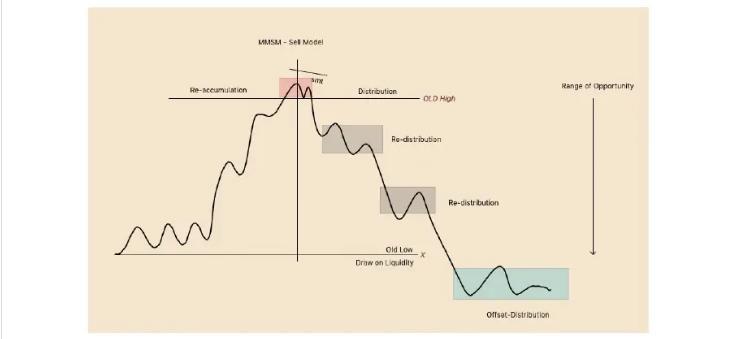
MMXM Model Market Maker Models
MMXM Model: Market Maker Models. This lesson explains how MMBM and MMSM develop, where liquidity is targeted, and how to identify the model forming.

Ever wondered how professional traders seem to predict key price levels with precision? The secret lies in understanding the ICT PD array matrix and how they relate to bullish and bearish Order blocks.
Don’t worry if these terms sound complicated — we’re breaking it all down in simple terms to help you make sense of the charts and trade with confidence.
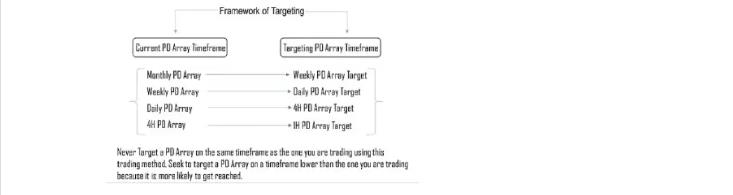
The ICT PD Array Matrix is a framework that organizes and prioritizes premium and discount zones across multiple timeframes, such as monthly, weekly, daily, and intraday charts. It helps traders identify how these zones interact and influence price movements, providing a structured approach to predicting market direction based on the alignment of order blocks, liquidity voids, and fair value gaps across different timeframes.
Think of premium and discount zones as a multidimensional array. In this matrix, multiple PD arrays combine and interact, collectively influencing market behavior.
For example, the way monthly or weekly discount zones impact daily discount zones can provide valuable insights into price movements. By mastering these PD arrays, you can uncover the true direction of the market with greater accuracy.
Imagine a scenario where the price is bearish on a 4-hour or daily timeframe, and a weekly order block is present within the discount zone. Understanding this relationship allows you to confidently execute a short position, anticipating that the price will move toward the weekly order block. By leveraging these PD arrays, you can piece together a comprehensive view of how the market operates, giving you a strategic edge in your trading decisions.
The PD Array ICT concept is a powerful ICT Trading tool that helps traders divide a price range into two key areas:
Premium Zone: This is the upper half of a price range, where prices are considered expensive. Sellers often dominate this zone, as it’s a good area to look for sell opportunities.
Discount Zone: This is the lower half of the price range, where prices are considered cheap. Buyers are more likely to step in here, making it an ideal area to look for buy opportunities.
These PD Array ICT zones are crucial because they reflect where the big players (institutions or “smart money”) might enter or exit trades.

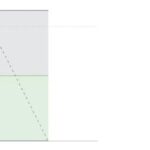
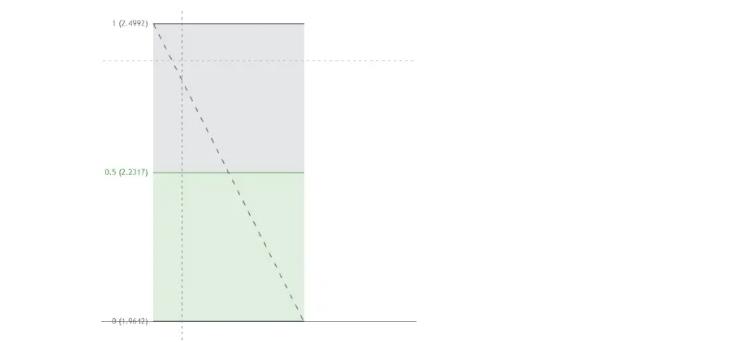
Arrays present below the 50% of fib levels are considered bullish PD arrays. They include:
PD Arrays in Trading above the 50% of fib level are considered bearish PD arrays. These are used for finding short opportunities.