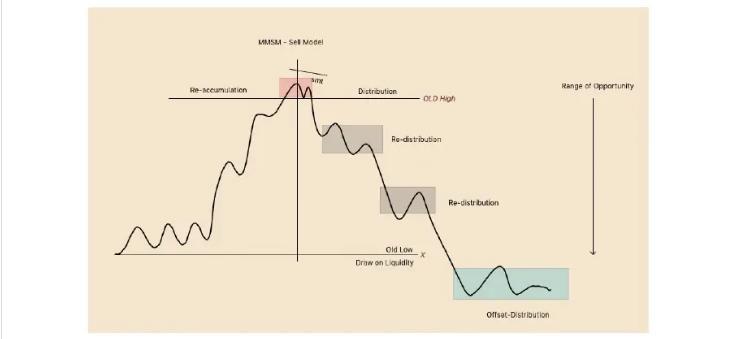
MMXM Model Market Maker Models
MMXM Model: Market Maker Models. This lesson explains how MMBM and MMSM develop, where liquidity is targeted, and how to identify the model forming.

Market structure simply refers to the way price moves in the market. Price does not move in a straight line upwards or downwards. Instead, it moves in a series of waves or steps, creating identifiable patterns that traders use to understand market direction.
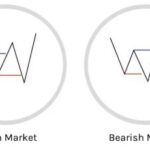
There are two main types of market structure:
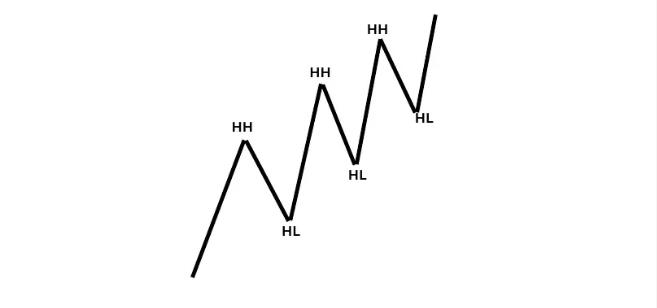
Defined by a sequence of Higher Highs (HH) and Higher Lows (HL). It shows that buyers are in control, pushing the price higher.
The reason they are called Higher Highs is because each new high surpasses the previous high, showing continued strength from buyers. In the same way, a Higher Low means that each new low forms above the previous low, proving that sellers are unable to drive price down as far as before. This gradual stepping pattern creates an uptrend.
Note: When traders talk about “buy low”, in an uptrend, they are usually referring to buying at the Higher Low (HL).
This is the most favorable point to enter long positions, as it provides the lowest price within the bullish structure before the next move up towards a new Higher High (HH).
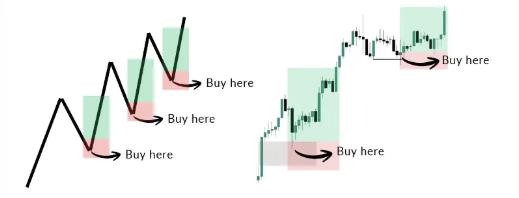
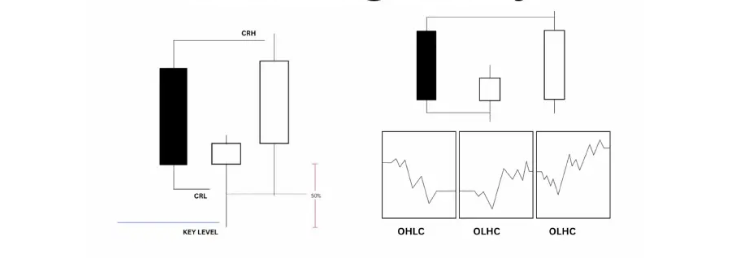
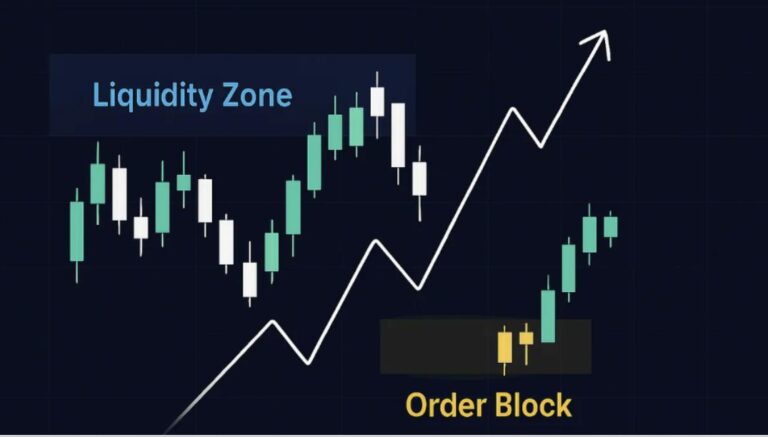
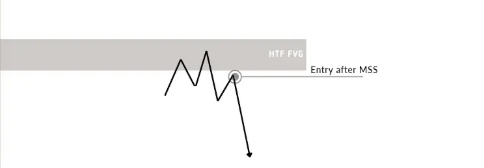
From the diagram above, it can be observed that although price was moving to the upside, consistently creating higher highs and higher lows, entries were not taken from random points in the market.
The first entry was identified at a Fair Value Gap (FVG), while the second entry was taken after a Liquidity Sweep.
If these terms sound unfamiliar at this stage, do not worry. Each of these concepts will be explained in detail in later chapters.
In a bearish market structure, price consistently forms lower lows and lower highs.
The reason they are called lower lows is that each new low breaks below the previous low, showing that sellers are pushing price further downward.
As this continues, every subsequent low becomes lower than the one before it.
At the same time, when price attempts to create highs, each new high fails to reach the level of the previous high. This results in a series of lower highs, which reflects weakening buying pressure and confirms that sellers remain in control of the market.

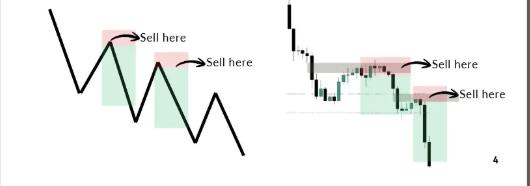
When traders say sell high, they are not suggesting that you sell in the middle of a strong bullish market; that would be a costly mistake. Instead, what they mean is that in a downtrend, the best place to enter a trade is around the formation of a lower high.
This is because lower highs serve as retracement points where sellers are likely to step back in and continue driving prices lower.
By positioning your entry at a lower high, you are able to capture the next move toward the lower low. This not only gives you a more precise entry, but it also improves your risk-to-reward ratio and increases your overall win rate.
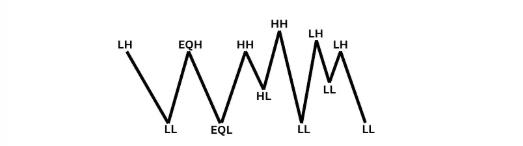
Consolidation, also known as a ranging market, occurs when price moves between a defined high and low without showing any clear direction. In this phase, the market is neither trending upward nor downward; instead, price keeps bouncing between support and resistance levels.
From the diagram above, you can clearly see that this type of price action is different from the two other market structures we discussed earlier. In a consolidation phase, price keeps creating lower highs, lower lows, higher highs, higher lows, and even equal highs and equal lows within the same confined area.
That is why the best approach is to wait for price to break out of the range, either above the high or below the low.
A Market Structure Shift (MSS) or a Change of Structure (CHOCH) occurs when price changes direction by breaking a key structural point, such as a previous high or low, indicating that momentum is shifting to the opposite side of the market.
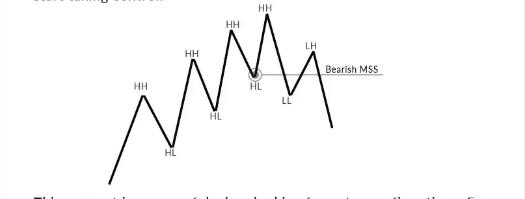
For example, in a bullish trend, price continuously forms higher highs (HH) and higher lows (HL). As long as each new low is higher than the previous one, buyers remain in control. However, when price breaks below a previous higher low, it signals a market structure shift / Change of Character from bullish to bearish. This break suggests that the buying momentum is weakening, and that sellers may now start taking control.
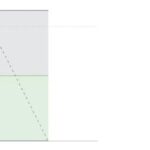
The image displays a line graph showing a series of peaks and valleys:
A horizontal line is drawn through the final HL (Higher Low). Once the price drops below this line to form a LL (Lower Low), it is labeled as a Bearish MSS.
This concept is very useful when looking for entry confirmations. For instance, if you want to sell, you should wait for the market to shift structure to the downside first, confirming that a potential reversal is taking place, before entering your trade.
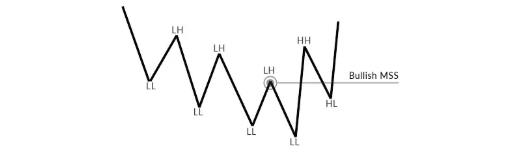
Similarly, in a bearish trend, price keeps forming lower highs (LH) and lower lows (LL).
When price breaks above a previous lower high, it shows that the market has shifted from bearish to bullish, signaling that buyers are now beginning to dominate.
A Break of Structure (BOS) occurs when price continues moving in the same direction by breaking a previous high or low within the ongoing trend. Unlike a Change of Character / Market Structure Shift (MSS), which signals a possible reversal, a Break of Structure in Trading simply confirms trend continuation.
In a bullish market, when price breaks and closes above a previous higher high, it indicates that buyers are still in control and the uptrend remains intact.
On the other hand, in a bearish market, when price breaks and closes below a previous lower low, it confirms that sellers are maintaining dominance and the downtrend remains intact.
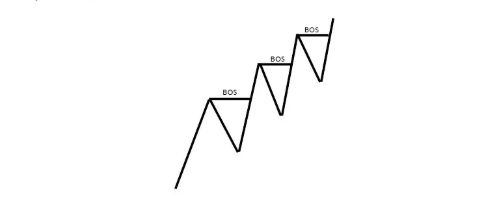
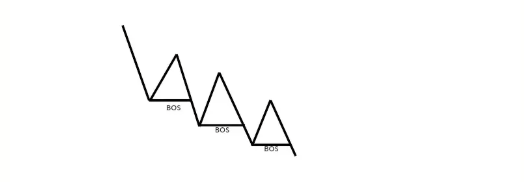
In simple terms, a Break of Structure in Trading helps traders confirm trend strength.
When you see consistent breaks of structure in one direction, it means liquidity is being engineered higher or lower, giving you confidence to follow the trend rather than fight against it.