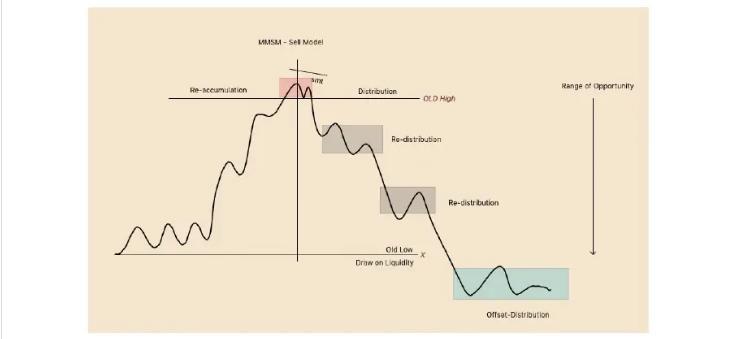
MMXM Model Market Maker Models
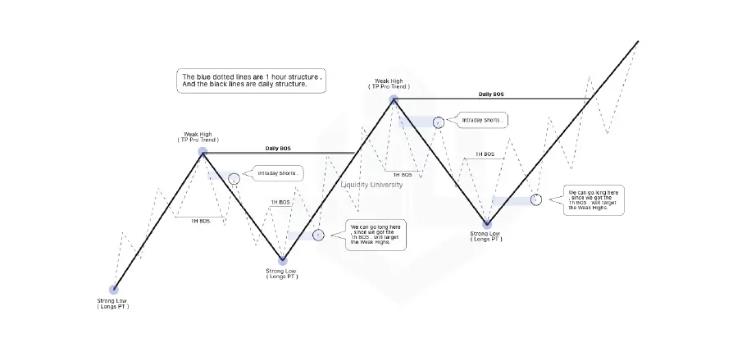
MMXM Model: Market Maker Models. This lesson explains how MMBM and MMSM develop, where liquidity is targeted, and how to identify the model forming.

Daily Bias doesn’t have to be difficult. Understanding daily bias is easier than you think.
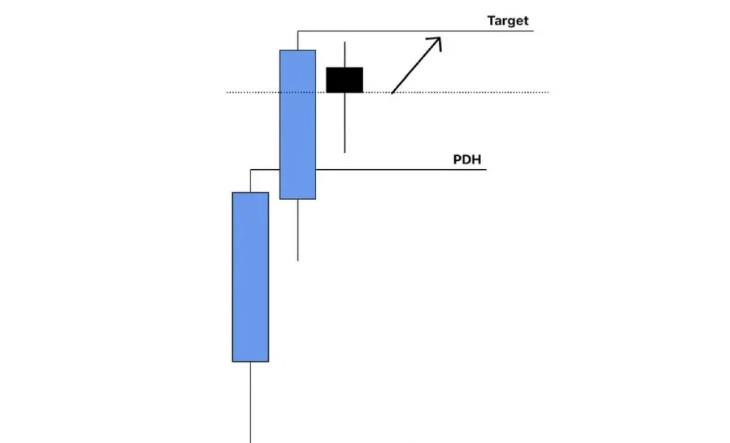
On Tuesday, price closed above Monday’s daily high.
On Wednesday we can anticipate price to target Tuesday’s high.
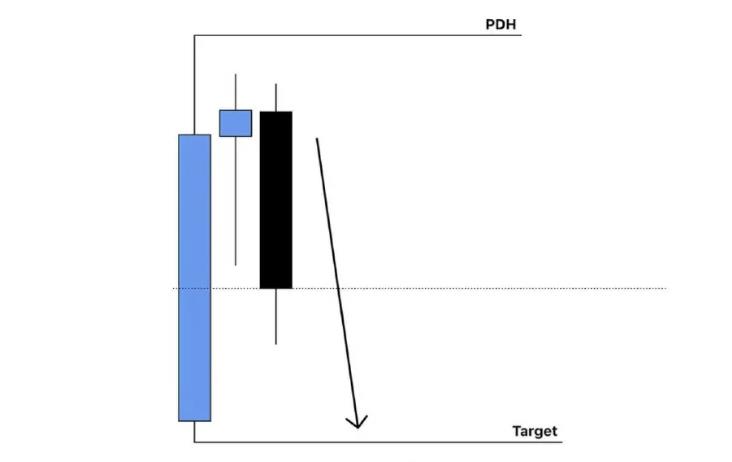
On Tuesday, price closed below Monday’s daily high.
On Wednesday we can anticipate price to target Monday’s low.
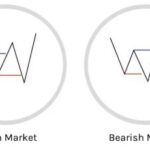
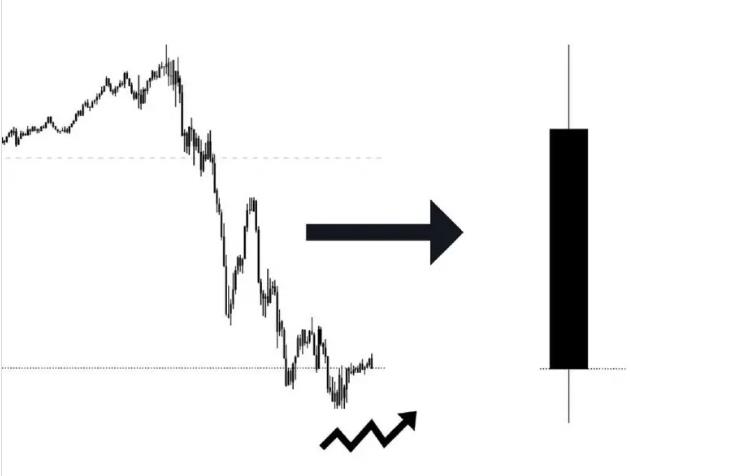
When price closes above the previous day’s high (PDH) or below the previous day’s low (PDL), it confirms strong market momentum in that direction, suggesting the trend will continue.

Conversely, if price wicks above PDH but closes below, or wicks below PDL but closes above, it indicates a rejection of those levels — a sign that the market may reverse direction, because of the inability to sustain beyond key levels.