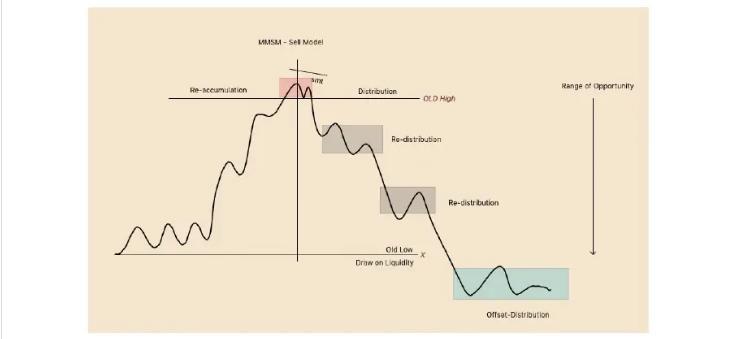
MMXM Model Market Maker Models
MMXM Model: Market Maker Models. This lesson explains how MMBM and MMSM develop, where liquidity is targeted, and how to identify the model forming.

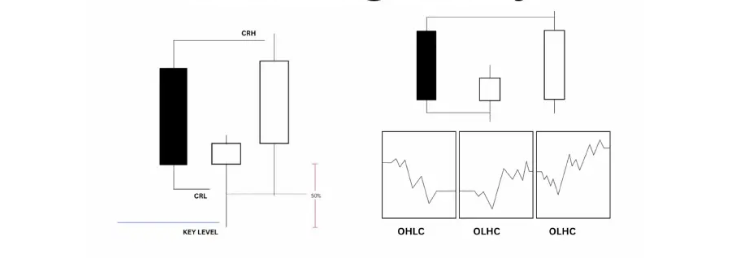
When using CRT Trading, it is important to find and understand what candle ranges to look for. We can use candles as a structure or “skeleton” to have a good understanding on what price wants to do, and when.
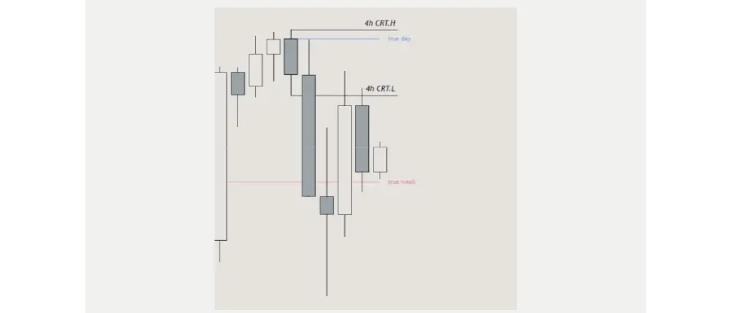
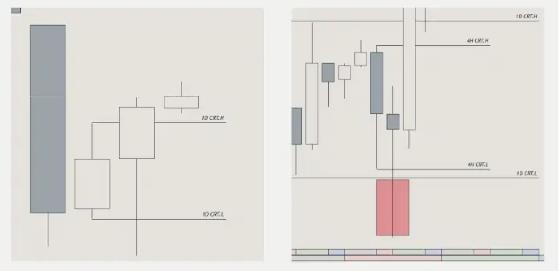
When creating our bias, we always start on the higher time frames to look for our CRT (Candle range Theory). The higher time frame holds higher power.
These are the daily and 4-hour CRT; They will be used as the higher time frame. The highlighted area is where entries will take place – buy the lows, sell the highs.
After establishing your higher time frame CRT, drop down to the lower time frames to look for entries. Since everything in the market is fractal, Candle range theory also is on the lower time frames, allowing for more accurate entries.
Note: For the most precise entries and confirming bias with narrative, use Quarterly Theory QT; this will not be taught here. Aligning these two concepts will increase the performance of the CRT model trading.
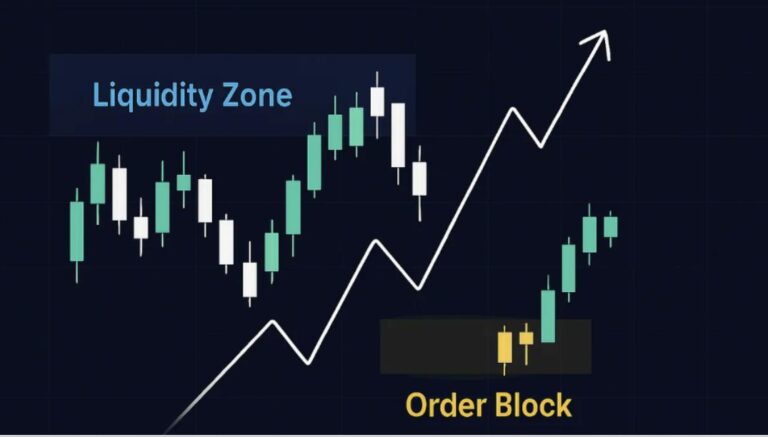
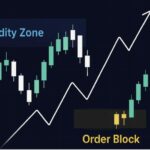
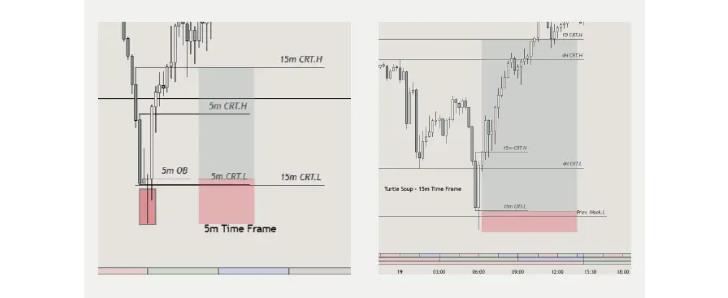
Once time is aligned, our Candle range theory is aligned, then we may look for opportunities for taking positions. There are many ways to enter trades using Candle range theory. But the two most common are Order Block /CISD Trading or using Turtle Soup Trading on a lower time frame.
Best time frames for taking trades are the 15m and 5m chart. So i suggest starting with the 15m and the 5m first.
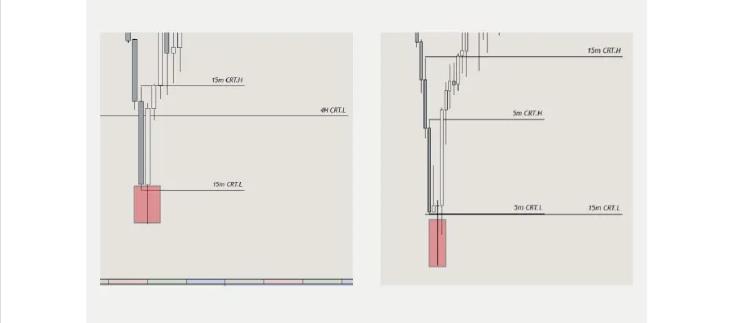
When in a trade, your take profit will be the time frame above what you are taking entries on high. So, if you are entering on the 5m, you could target the 15m or 1 hour high. For the 15m, you would target the 4h high or the daily high etc.
As we already know, Candle range theory (CRT Trading) focuses on ranges. The way that Candle range theory had been taught through this document, is that price stays within the range and Turtle Soups the low/high and will reverse to the other end of the range.
In some cases, prices will trade out of the range, and we do not get a reversal. When this happens, it is just best to observe and not engage in price. There are ways to take trades using a continuation model, but it is less affective and not worth using in most cases.
This was meant to help you understand how to see the charts in a more fractal way and help you be able to breakdown your trades into smaller steps. This is part 1 of the series and in the next parts we will go deeper into these concepts.
The next Parts are covered in our Mentorship Program.