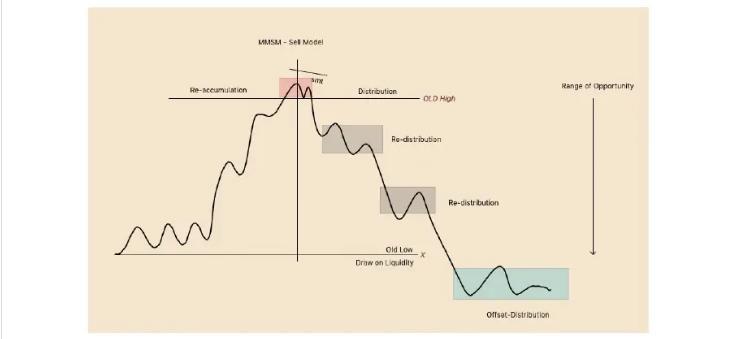
et-loader

What is CRT Day Trading

When it comes to the question - What is CRT Day Trading? It is simply a Trading Concept focused on the CRT Trading Strategy In ICT Trading CRT stands for Candle Range Theory While practicing ICT Trading, you will learn...

What is CRT Day Trading

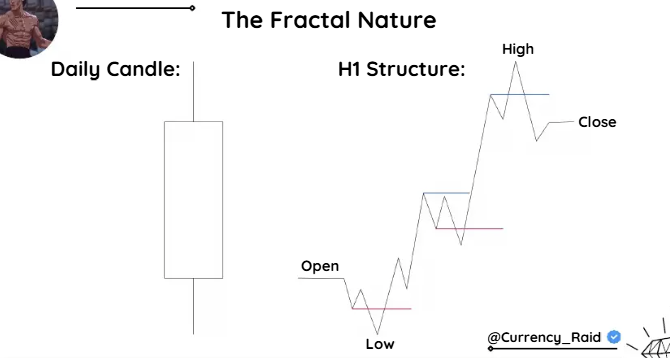
It is simply a trading concept focused on the CRT Trading Strategy. In ICT Trading, CRT stands for Candle Range Theory. While practicing ICT Trading, you will learn about CRT Trading and how you can use the CRT Trading Strategy to stay on the winning side of the market.

A Comprehensive Technical Breakdown of Candle Range Theory (CRT Trading)

Core CRT Trading Concepts

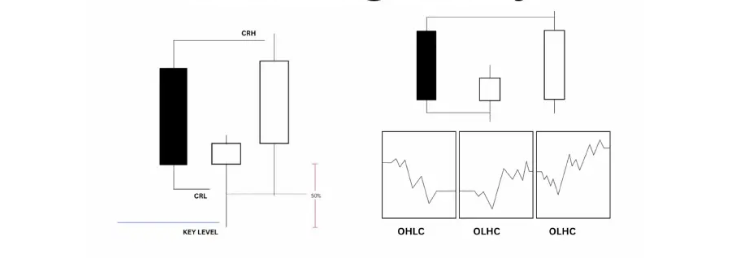
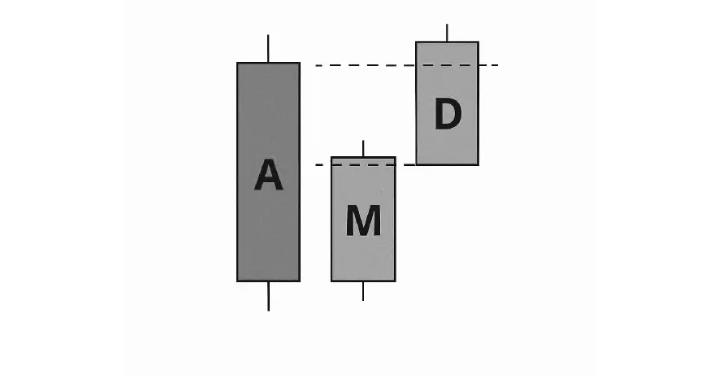
CRT (Candle Range Theory) is based on the idea that every candle is a range that contains three phases:

  • Accumulation (A)
  • Manipulation (M)
  • Distribution (D)

Based on ICT Trading, a CRT can form on any timeframe and helps interpret price.

  • Model #1 (Entry Model): A single decisive candle that liquidates a high or low (liquidity grab). This is not a zone or cluster, but a specific candle that triggers a major move.
  • ICT Turtle Soup: A stop-hunt pattern where price takes out an obvious high or low before reversing.

Advanced ICT Trading Concepts

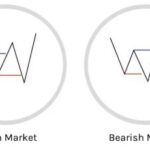
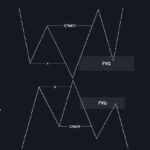
SMT (Smart Money Technique) is an ICT Trading concept. SMT is simply divergence between correlated assets, such as BTC and ETH, that signals expansion.

  • SMT Trading = Expansion
  • Bullish SMTs are valid only in bullish higher timeframe markets.
  • Bearish SMTs are valid only in bearish higher timeframe markets.
  • ICT Trading FVG (Fair Value Gap): A price imbalance left behind by a rapid move. It acts as a magnet for retracement or reaction.
  • Market Profile: The visual structure of price activity showing highs, lows, and balance zones, where price spent the most time. It is used to confirm structure.

chart

The Trade Framework

5-Step Trading Process

  1. Higher Timeframe Narrative: Identify the overall candle shape (daily/weekly/monthly). Determine whether price is bullish, bearish, or neutral and locate liquidity pools, FVGs, Order Blocks, or prior highs/lows.
  2. Market Profile and Structure: Mark recent highs/lows and identify any true market structure shift with confirmed closes above or below key levels.
  3. Stack Confluences: Combine multiple signals, including CRT Trading formation, FVG location, SMT confirmation, Model #1 candle, and liquidity context.
  4. Define the Entry: Only after confluences align, identify the entry model, either a Model #1 candle or a True Market Structure Shift.
  5. Risk Management: Place stop-loss near the Turtle Soup low or high where it is unlikely to be swept. Manage position size according to fixed risk per trade.

Candle Range Theory Model

Warning: Always verify that all confluences align before entering any trade. Missing even one key element significantly reduces the probability of success.

Process Flow: Higher TF Bias -> Market Profile Analysis -> Confluence Stacking -> Entry Confirmation -> Risk Management

chart

ICT Course

Learn ICT Trading in the right order

Structured modules from liquidity and market structure to live execution — no scattered videos, no fluff.

Stay ahead of the market

Get new ICT articles and setups every week

Join traders who are learning to read price through smart money concepts — one article at a time.

No spam. Unsubscribe any time.

Related articles