Mastering ICT Trading
A Complete Blueprint to ICT Trading Strategy. This guide covers liquidity, dealing ranges, premium and discount, PD arrays, order flow, and other core ICT concepts.

Liquidity is created when traders place and execute orders in the markets. There are four types of Orders in the markets.
Buy Orders are the orders you place when you want to buy something at the current price. For example, if you enter a long position on $EURUSD now, that’s a Buy Order.
Buy/Sell Stops are stop losses. Let’s say you’re in a long position on EURUSD and place your stoploss below a recent low. That stoploss is a Sell Order for your Buy Position.
Since you’re in a Buy position, the only way to exit a Buy position is to Sell. Thus, it’s called a “Sell Stop” order.
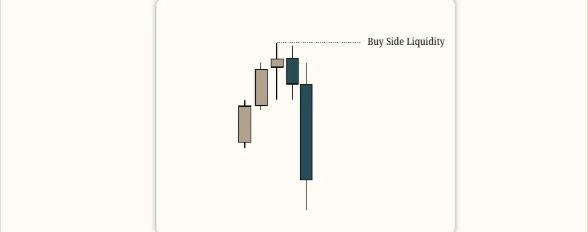
All the orders placed and executed create liquidity. We aim to identify areas with high liquidity pools (where lots of traders place their orders).
There are 2 variations of liquidity that you should understand. The first is price-based liquidity, which we just covered. The second is time-based liquidity. This is what we want to focus on.
The algorithm will always operate using Time and Price, so we can filter out the important levels of liquidity using this.
Here are some examples of Time-Based Liquidity:
And the same would go for lows.
Using this, we can refine the liquidity pools we are looking for in the charts.
For example, we can look at the Previous Day’s High or Low. And this isn’t limited to just the previous day; we can look back up to 3 intervals.
So, for example, we can look at the previous 3 sessions’ high or low, the previous 3 days’ high or low, and so on.
This way, we don’t have to “guess” which is the right liquidity pool. We can just focus on specific highs and lows that align with time.
This simplifies our trading process and allows us to be more specific with our trading strategy and model.
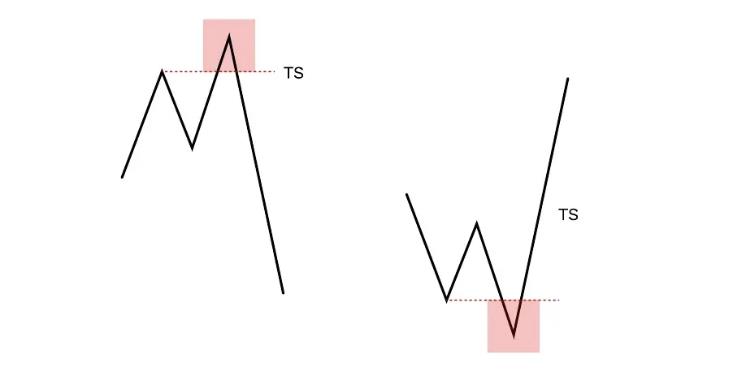
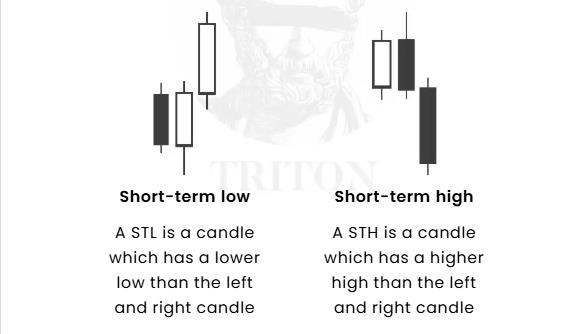
There are 2 types of Swing high and low which I focus on.
There is a very simple process that I use to determine the type of high/low on the charts. The first is using the Three-Candle Formation (TCF).
This is the simplest part of the market structure, but it’s the most confusing point, especially for beginners. Most of the time, you would mark out a “high” or a “low” based on the color of a candle.
So, a low will be a bullish candle, and a high will be a bearish candle. This is not the case at all. The ONLY way to determine a Swing high and Swing low is with the Three-Candle Formation (TCF).
So, whenever you’re marking out a Swing high and low, be sure it’s an ACTUAL high or low using the TCF method.
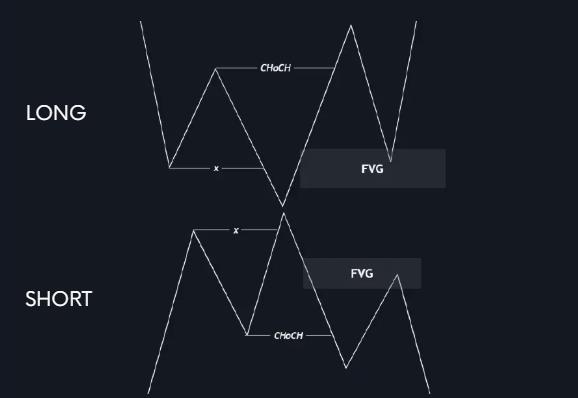
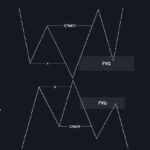
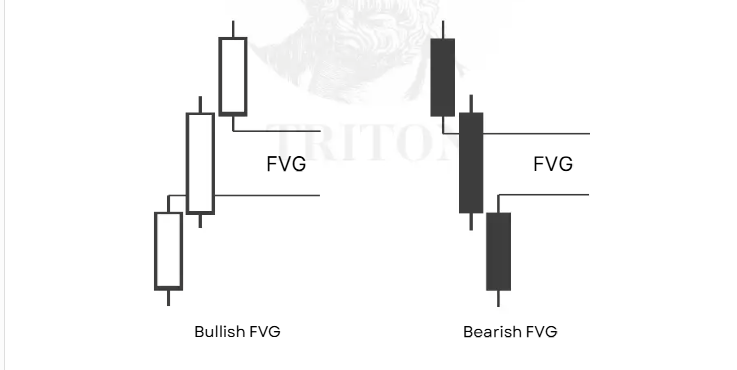
The “Fair Value Gap” (FVG) is sometimes referred to as an “imbalance” in price.
An FVG is a 3-candle pattern that forms when price makes a quick move to the upside or the downside. This leaves a “gap” in price. Usually, prices will come back to fill these gaps.
A FVG is an area of price where there are no overlapping candle wicks.
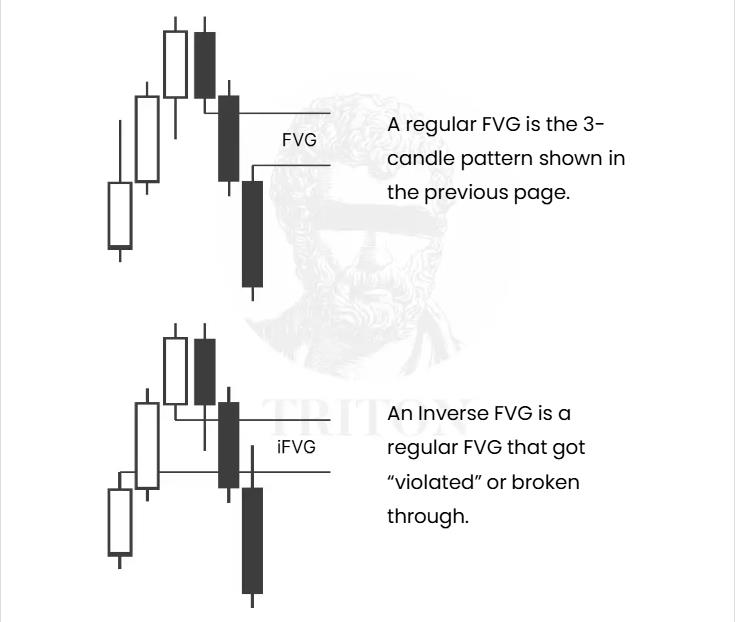
There are different variations of FVGs we can spot. The easiest ones to spot are the Regular FVG and the Inverse Fair Value Gap.
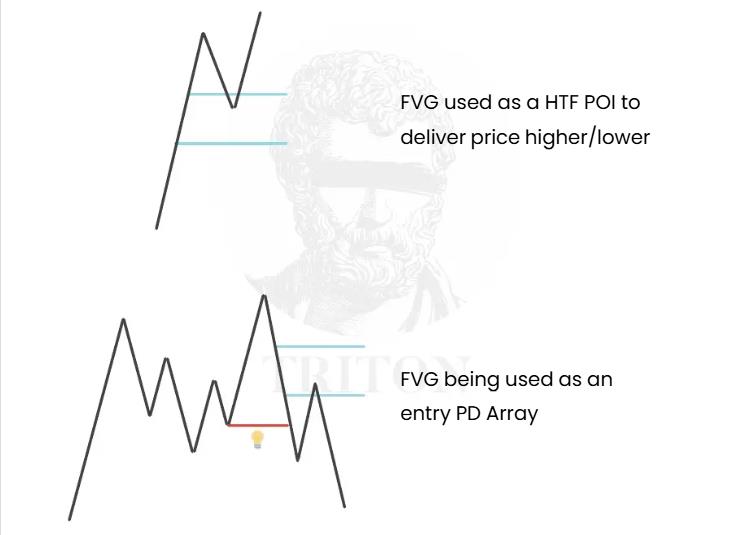
We can use FVGs in many different ways. We can use them as HTF Points of Interest (POI), as an entry PD Array, or wait for an Inverse Fair Value Gap retest.
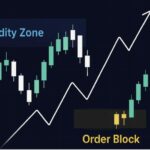
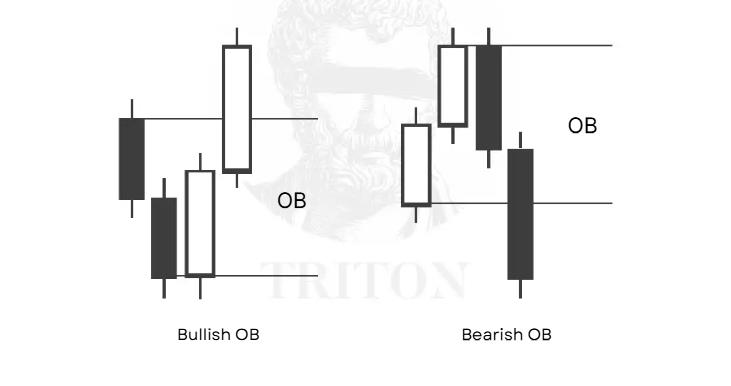
A bullish order block is the consecutive bearish candles before the move up. A bearish order block is the consecutive bullish candles before the move down.
Most traders usually confuse the Order block (OB) with a “supply” or “demand” zone.
To be clear, the Order block has nothing to do with supply or demand.
A bullish order block isn’t the “last bearish candle” before the move higher. It’s the “last consecutive bearish candles” before the move higher.
A bearish order block isn’t the “last bullish candle” before the move lower. It’s the “last consecutive bullish candles” before the move lower.
This is the simplest way to identify order blocks for beginners. There are other methods to identify and use the order block, and I won’t get into that in this e-book to keep it simple.
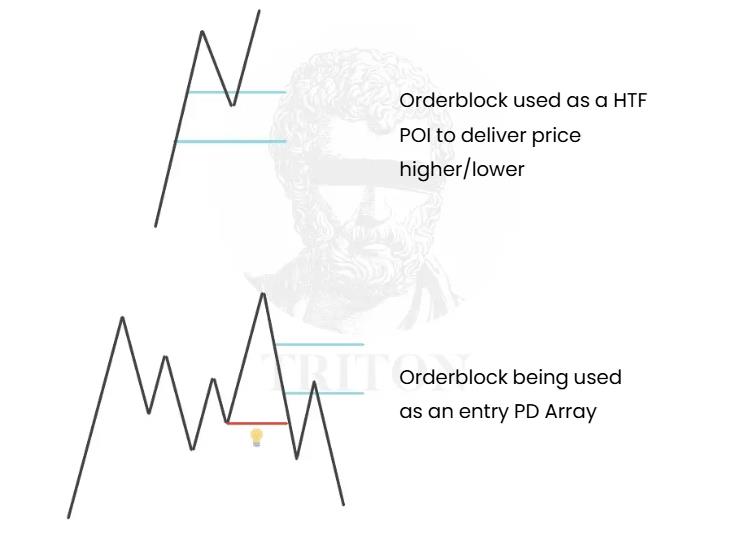
We can use order blocks in many different ways. We can use them as HTF Points of Interest (POI), as an entry PD Array, and to give us the HTF narrative / context.
There are multiple seasons during the year, and different seasons have different levels of volatility and liquidity in the markets.
Seasonality refers to a longer-term view, usually over a span of a few months. Certain seasons are usually better than others when it comes to trading.
Seasons you should AVOID:
The other months are usually good for trading and have a higher level of volatility/liquidity compared to the above months.
Kill zones are time windows during the day when most traders are trading, thus there’s more liquidity.
More liquidity → Better price action.
Forex ICT Kill zone times:
Indices ICT Killzone times:
You should focus on trading in the London or the New York session only. All timings are in EST (New York time).
ICT Silver Bullet Strategy are 1-hour windows during a Killzone when price will rebalance a FVG and run towards the short-term Draw on Liquidity (DOL).
Silver Bullets:
The NY PM Silver Bullet only applies to indices. I don’t use it for forex or any other market.
I usually trade during the London Open Silver Bullet for forex and during the NY AM Silver Bullet for indices.