et-loader

Liquidity Sweep Trading Model

Read this First: Before using this Liquidity sweep model, you must have a clear daily bias. If you haven't already, go through the Daily Bias Model document first. This model is only used after you know which direction...

Liquidity Sweep Trading Model

Read this First: Before using this Liquidity sweep model, you must have a clear daily bias. If you haven’t already, go through the Daily Bias Model document first. This model is only used after you know which direction you want to trade for the day.

This Liquidity Sweep model alone can make you profitable. It’s the highest-probability model in trading and has been the #1 reason most students in the program have become consistently profitable. Follow this exactly-please don’t skip the steps.

  1. Start With Your Daily Bias The liquidity sweep model is built on context. Without a daily bias, there is no edge.
    – If your daily bias is bullish, only look for buys.
    – If your daily bias is bearish, only look for sells.

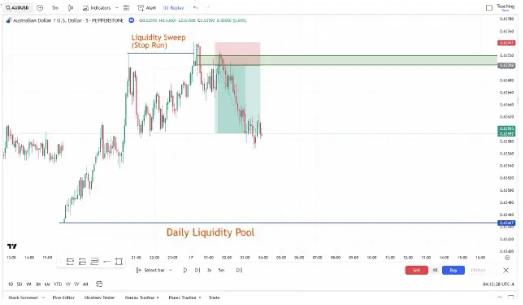
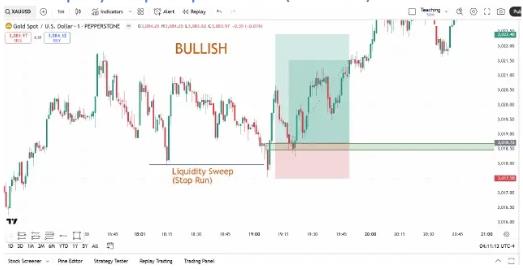
What makes this model high probability is only trading in the direction of the bias after a liquidity sweep (stop run) has occurred.
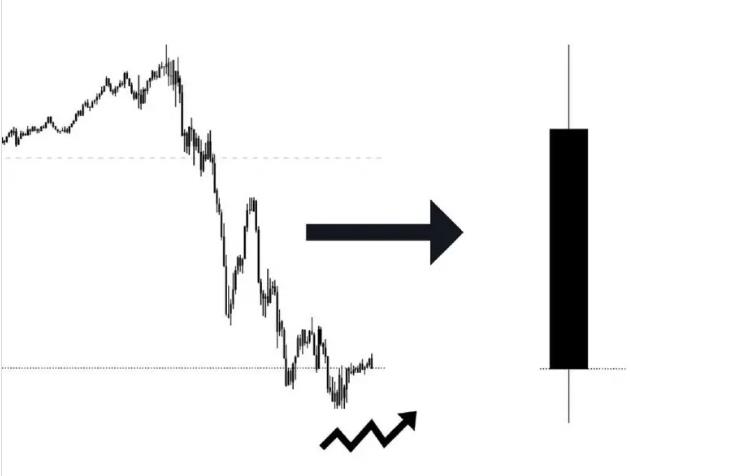
  1. What Is a Liquidity Sweep?

A liquidity sweep is a stop run-price moves sharply in the opposite direction of your daily bias, taking out stop loss orders, and then aggressively reverses.

  • If bullish: price sweeps lows first, then moves up
  • If bearish: price sweeps highs first, then moves down You’re looking for that quick and aggressive reversal-not a slow, choppy retrace.

⚠️ Avoid price action that consolidates after the sweep or takes too long to reverse.

Skip it.

  1. Forget Market Structure You do not need to analyze market structure. That will only confuse you and cause What we’re looking for is simple:
    – A clear sweep of a prior high/low (liquidity taken)
    – A fast, aggressive reversal in the direction of the daily bias If those two conditions are met-you have a valid setup.
  2. Entry Timeframe = Trigger Timeframe The liquidity sweep must happen on your entry timeframe.

As a general rule: the lower the time frame, the more liquidity sweeps there are but the less reliable the price action.

No Liquidity sweep = No trade.

  1. Entry After the Liquidity Sweep Once the Liquidity sweep happens against the bias and you see an aggressive shift into the bias direction, you look to enter.

This is one of the highest-probability setups in all of Trading.

Entry Options:

  • Fair Value Gap (FVG) – Great for confirmation. If there are multiple FVGs, then pick the highest FVG when bearish and the lowest when bullish.
  • Order Block (OB) – Look for the last up/down candle before the reversal.
  • Optimal Trade Entry (OTE) – Enter at the 0,705% Level.

Choose what fits your style and confidence. All are valid.

  1. Stop Loss Placement (Non-Negotiable) Your stop must be at the Liquidity sweep high or low.
    – Bullish bias — Stop loss goes below the Liquidity sweep low
    – Bearish bias — Stop loss goes above the Liquidity sweep high You must put your stop loss at the liquidity sweep high when bearish and at the liquidity sweep low when bullish. It is pointless to wait for a liquidity sweep if you don’t do this!!!
  2. Timing Matters While the Liquidity sweep can technically happen at any time, your entry must be within a key time window to maintain the model’s edge.

You’ll learn the exact times to trade in later modules.

Note : Swing traders can avoid this and trade at any time.

  1. Timeframe Significance: Not All Sweeps Are Equal The Liquidity Sweep model works on all timeframes-from scalping to Swing Trading.

But keep this in mind:

  • The lower the timeframe, the more sweeps you’ll see… but also the less reliable the price action.
  • The higher the timeframe, the fewer sweeps… but they’re far more reliable A Liquidity Sweep on the 4H chart carries way more weight than one on the 1-minute.
    9. Liquidity Sweep Example

Bullish Liquidity sweep Example

  • Daily Bias: Bullish
  • Liquidity Sweep: Price runs below previous lows, grabbing stop losses
  • Reversal: Sharp and aggressive move upward confirms the Liquidity sweep
  • Entry Zone: Order Block/ FVG after the sweep
  • Stop Loss: Just below the Liquidity sweep low
  • Result: High R/R continuation in the bias direction

Bullish Liquidity sweep Example

chart

  • Daily Bias: Bearish
  • Liquidity Sweep: Price breaks above previous highs, taking out stops
  • Reversal: Immediate drop back down confirms the sweep
  • Entry Zone: OB/FVG after the sweep
  • Stop Loss: Just above the sweep high
  • Result: Clean continuation downward, aligned with the bias
    10. Recap Get your daily bias first Wait for a sweep against the bias on your entry timeframe Look for a fast, aggressive reversal

chart

Entry: Fair value gap (FVG), Order Block, or OTE Stop loss always at the Liquidity sweep high/low Entry must occur during key time windows (unless swing trading) Ignore market structure-just follow the sweep This Liquidity sweep model has made the most students profitable This is the highest probability ICT Trading model in all of trading

ICT Course

Learn ICT Trading in the right order

Structured modules from liquidity and market structure to live execution — no scattered videos, no fluff.

Stay ahead of the market

Get new ICT articles and setups every week

Join traders who are learning to read price through smart money concepts — one article at a time.

No spam. Unsubscribe any time.

Related articles