Mastering ICT Trading
A Complete Blueprint to ICT Trading Strategy. This guide covers liquidity, dealing ranges, premium and discount, PD arrays, order flow, and other core ICT concepts.

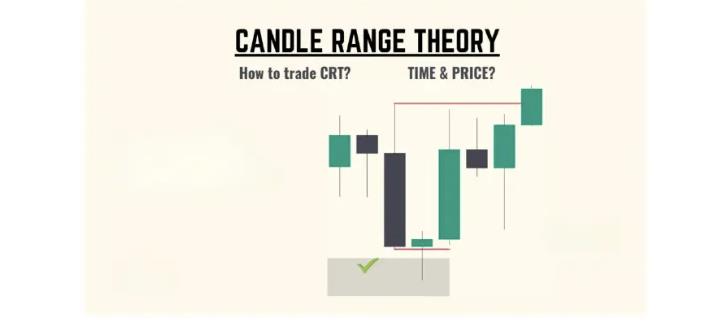
The Candle Range Theory (CRT) is an ICT Trading concept that analyzes market movements within the price ranges of candlesticks. It is beneficial for understanding price action across different timeframes and identifying optimal trade setups. To refine trading strategies, CRT combines technical analysis principles, such as liquidity, accumulation, manipulation, and distribution phases.
Inner Circle Trader Candle Range Theory. CRT Trading is a trading methodology centered on analyzing candlestick ranges to interpret price dynamics in financial markets. It examines the interaction between the high, low, open, and close of a candlestick within the broader market context.
CRT Trading integrates seamlessly with concepts like the ICT Trading Power of Three — Accumulation, Manipulation, and Distribution — and Smart Money Concepts (SMC), offering traders deeper insights into institutional market behavior and liquidity-driven price movements.
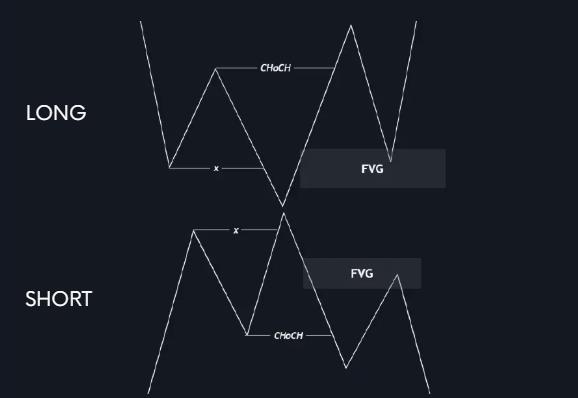
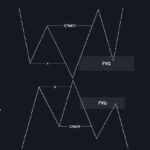
Not at all. In fact, they offer us valuable zones that, when understood correctly, can serve as powerful standalone market analysis tools — these are known as ICT breaker blocks.
Every candlestick represents a range defined by its high and low prices. The body of the candle (between open and close) reflects the primary price movement, while the wicks (shadows) show market dynamics beyond this range.
On higher timeframes, a single candlestick encapsulates broader price action. When zoomed into lower timeframes, the same candlestick reveals detailed phases like accumulation, manipulation, and distribution.
Candlestick as a Range:
To use Candle Range Theory (CRT) with ICT Trading concepts you must have a true understanding of the market, how smart money manipulates price, and the forces that impact price.
Make a top-down analysis first and integrate it with key timeframes for trading. To trade effectively using Candle Range Theory:
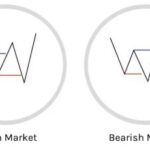
A bullish CRT represents a trading period where the closing price is higher than the opening price, symbolizing upward momentum in the market. It serves as a visual representation of positive sentiment, driven by strong buying pressure.
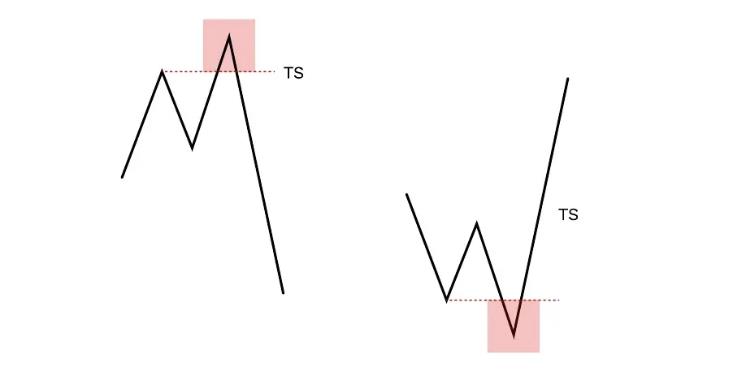
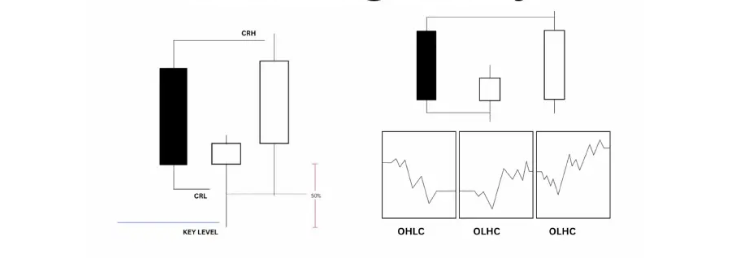
If the price is at a key support level on a higher time frame, you can consider looking for a bullish CRT (Close-Reject-Tail) model. To identify a bullish CRT model:
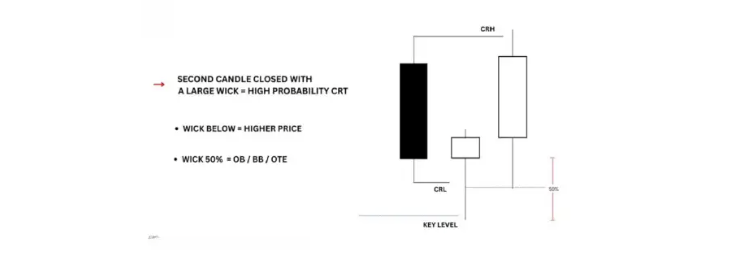
This entire sequence may occur with just three candlesticks, but in some cases, it could require additional confirmation.
If the price is at a key resistance level on a higher time frame, you can look for a bearish CRT (Close-Reject-Tail) model. To identify a bearish CRT model:
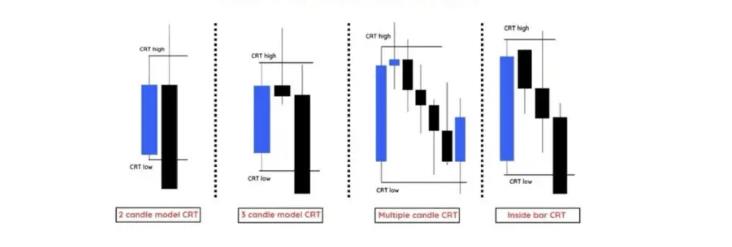
This sequence can often occur with just three candlesticks but might take additional confirmations depending on the market context.
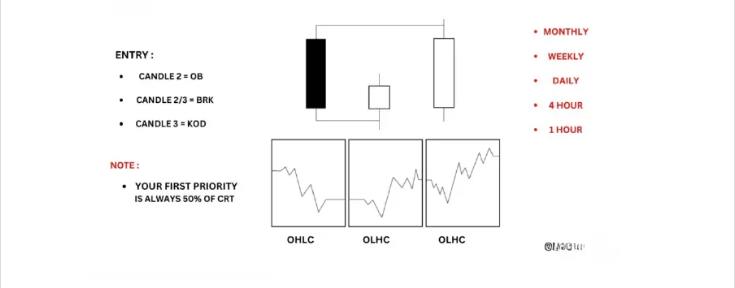
The best time to apply the CRT in trading, especially within the ICT framework, is during specific time windows that offer high probability trade setups. These are:
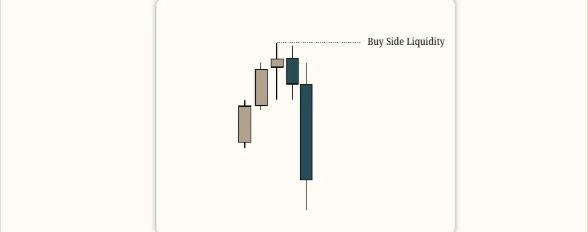
These time slots align with key sessions where institutional traders are active, often causing significant market moves. According to ICT, traders should monitor how a candle purges the high or low of the first candle and then closes back inside its range. This purge and return create ideal conditions to enter trades on lower timeframes (LTF).
Additionally, observing the 4-hour candle formations within a broader range of 1am – 9am EST helps traders align with higher time frame arrays (HTF PD arrays), enhancing accuracy and confluence in trade decisions.
CRT Trading identifies optimal trading opportunities during major forex sessions:
Candle Range Theory (CRT) integrates effectively with other Trading Strategies by leveraging its core principles — such as analyzing candlestick ranges, liquidity phases, and multi-timeframe analysis — and combining them with established ICT Trading concepts.
CRT Trading aligns seamlessly with the ICT Power of Three framework — Accumulation, Manipulation, and Distribution — to predict market cycles:
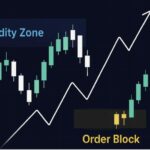
The use of multi-timeframe analysis enhances CRT trading by combining higher timeframe insights with lower timeframe precision. Traders analyze higher timeframe candlesticks — such as daily or 4-hour charts — to identify key levels like daily highs, lows, or areas of liquidity.
Then, they zoom into lower timeframes (like the 1-hour or 15-minute charts) to pinpoint precise entry and exit points.
This ensures that trades are not only technically sound on the lower timeframe but also aligned with the broader market direction, increasing the probability of success.