A Beginner-Friendly Guide to Inner Circle Trader's ICT Trading Concepts
A Beginner-Friendly Guide to Inner Circle Trader’s ICT Trading Concepts
Phase 1 — Foundation
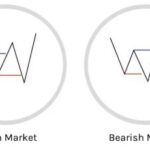
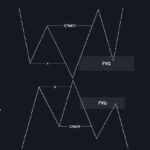
Market Structure — Learn how the market moves in trends. Uptrend = Higher Highs (HH) and Higher Lows (HL). Downtrend = Lower Highs (LH) and Lower Lows (LL). Break of Structure (BOS) shows continuation, while Change of Character (CHOCH) shows reversal.
Liquidity — Liquidity means where traders put stop losses. Buy side liquidity = stops above highs. Sell side liquidity = stops below lows. Smart Money Concept traders hunt these levels before moving price.
Time of Day (Sessions) — The market moves strongest during London and New York sessions. London (2AM-5AM EST) and New York (7AM-10AM EST) create fake moves and real trends.
Exercise: Backtest 30 days of charts. Mark Break of Structure, liquidity sweeps, and session highs/lows.
Phase 2 — Core ICT Trading Concepts
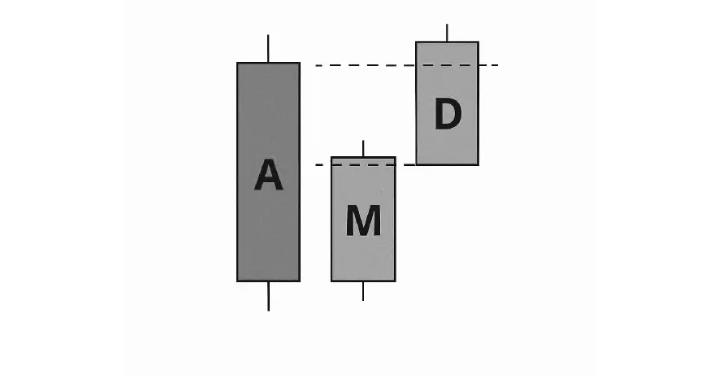
ICT Trading Power of 3 (PO3) — Price follows 3 phases: Accumulation → Manipulation → Distribution. Wait for the stop hunt (false move), then catch the real move.
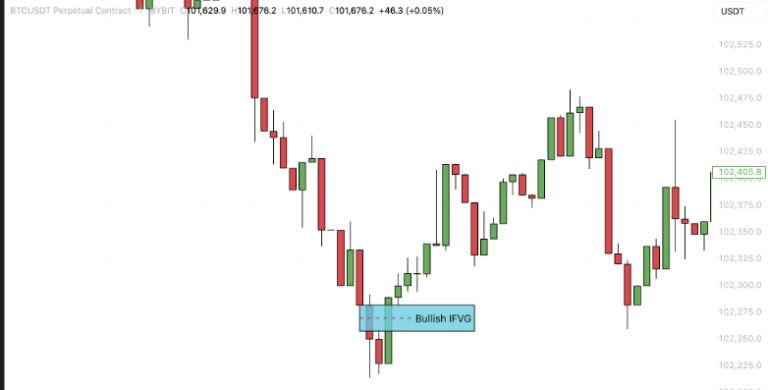
ICT Trading Fair Value Gaps (FVGs) — A 3-candle imbalance where price moves too fast. Price usually returns to fill this gap before continuing.
Order Blocks (OBs) — An Order Block = last down candle before an up move (bullish Order Block), or last up candle before a down move (bearish Order Block). They mark zones where institutions place trades.
Exercise: On each chart, highlight OBs and FVGs. Notice how price reacts.
Phase 3 — ICT Trading Entry Models
Liquidity Sweep + Market Structure Shift — Step 1: Wait for Liquidity grab above/below highs/lows. Step 2: Watch for Market Structure Shift (MSS). Step 3: Enter the Trade at an Order Block or a Fair Value Gap.
OTE (Optimal Trade Entry) — Use Fibonacci retracement. The 62%-79% zone is the sweet spot for entries. Combine it with an Order Block or a Fair Value Gap for higher accuracy.
Breaker Block Trading & A Mitigation Block — Breaker Blocks = A failed Order Block that flips into support/resistance. A mitigation Block = A zone where institutions re-balance positions.
Exercise: Backtest 50 setups using ICT Trading entry models. Record results.
Phase 4 — Higher Timeframe Bias
Daily Bias — Use previous day’s high/low, daily open, and weekly open. If price is above daily open = bullish bias. Below = bearish bias.
Judas Swing Trading ICT — A Judas Swing is a false move in the morning (stop hunt), followed by the true move in the afternoon. Very common in New York sessions.
Exercise: Each week, build a plan using Daily Bias. Check how the Judas Swing appears.
Phase 5 — Execution & Risk
ICT Trading Risk Management — Only risk 1-2% per trade. Place Stop Loss beyond liquidity or Order Block. Take Profit at opposite draw on Liquidity.
Journaling — Keep a trading journal. Record entry, stop, target, and outcome. Review at least 20 trades each weekend.
Backtesting Routine — Study charts daily. Find 3-5 repeating setups and focus only on those.
Note: Follow the ICT Trading concepts correctly.
ICT Course
Learn ICT Trading in the right order
Structured modules from liquidity and market structure to live execution — no scattered videos, no fluff.
CISD meaning in Trading is Change in the State of Delivery refers to a shift in the direction of price delivery or Change in the state of delivery (CISD Trading) is an early indication of MSS (Market structure shift),...
When it comes to the question - What is CRT Day Trading? It is simply a Trading Concept focused on the CRT Trading Strategy In ICT Trading CRT stands for Candle Range Theory While practicing ICT Trading, you will learn...